Download – Avanade Extensions - Burndown+
Problem
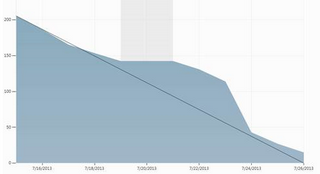
The Sprint burn down for few users would plot incorrectly. As you can see in the sample screen shot below, the sprint burn down has plotted like a sawtooth wave. Though the sprint burn down chart is expected to be plotted as shown in the screen shot on the right.
| Actual | Expected |
|---|---|
 |
 |
Root cause
We have found the invalid code logic in our extension that is causing the saw tooth like plotting of the sprints. It would only ever happen to teams where there is a gap between the sprint end date and sprint start date. Not that having a gap is in correct, it’s just that our logic wasn’t handling this correctly. We have fixed the bug and have rolled out the fix in v1.3.1.
Next Steps
We would encourage you to download the update and continue using Avanade Extensions, we have been overwhelmed by the positive feedback we received from the community. Please keep the feedback coming… We are listening!!!


