How I built a dashboard in Azure Portal to track Gitflow feature branches
Nov 4, 2018 | Utkarsh Shigihalli
| 4 min read
DevOps
Azure DevOps
Azure
Utkarsh Shigihalli
| 4 min read
DevOps
Azure DevOps
Azure
GitFlow is one of the popular branching strategies if you using Git version control. Most of the teams I have worked with generally are very satisfied using it. With fixed branch names, pull requests for code reviews, teams find that it fits very nicely with their day to day workflow. In this blog post, you will see how I built a useful dashboard in Azure portal to track whether teams following Gitflow strategy (especially their topic branches) as they should, giving teams an easy way to track stale branches and keeping their branches neat and tidy.
Our team love Azure DevOps and various productivity enhancements like strong branch policy options. We also love its squash merge feature. If you don’t know what it is, here is the quick definition from the docs.
Squash merging is a merge option that allows you to condense the Git history of topic branches when you complete a pull request. Instead of each commit on the topic branch being added to the history of the default branch, a squash merge takes all the file changes and adds them to a single new commit on the default branch
One of the problems we had was, people in our team were not deleting feature branches after their merge. This resulted in close to 20+ feature branches almost all of them stale, as the feature was already merged to develop branch. While Azure DevOps has an inbuilt option to delete the feature branch, people in my team just unchecked that option due to various options.
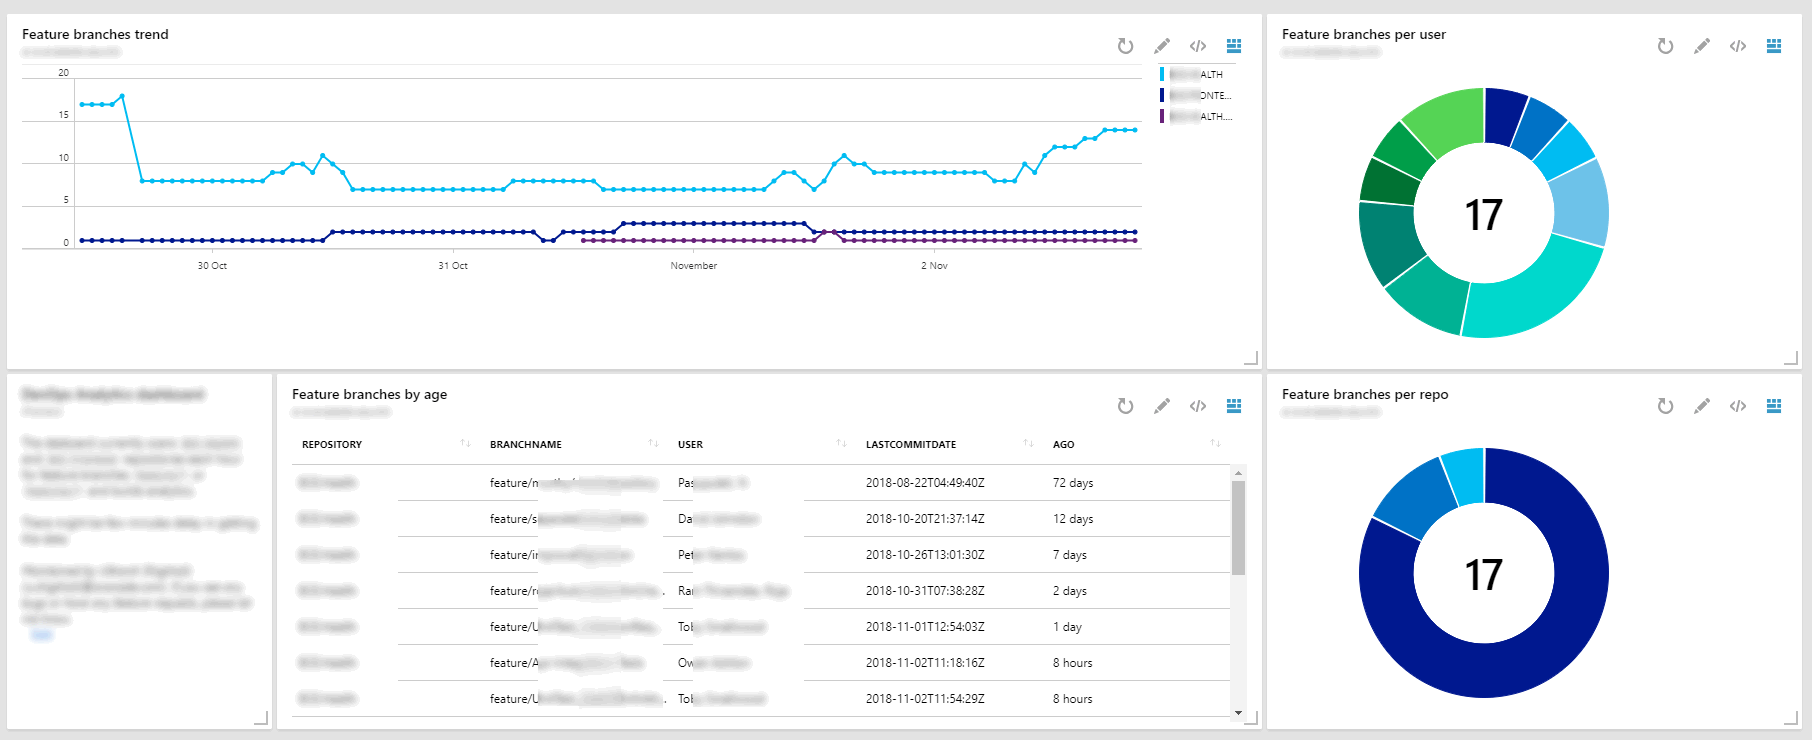
So I decided to build a dashboard on the Azure Portal and put it on a big screen so that everyone can see it always. For the start, I have the following things on the dashboard.
- A dynamic timeline chart with the feature branch growth
- A chart to show who owns the highest number of feature branches
- The number of feature branches per repo.
- A table with feature branch name, date of the last commit in that.
So this is how it looks (click on it for a bigger image).
I had a couple of requirements of my own on how I will implement it
- Get the branch details every hour
- No separate website to display the data
- No database to store historical data
- No website of my own means no JS charting library
So how did I build it?
Get the branch details every hour and store the data
This was achieved using Azure Functions. It was easy to get the details about the repository/branches and commit details via Azure DevOps REST API’s.
I built a simple Azure Function in C# using Timer Trigger.
[FunctionName("GitBranchHealth")]
public static async Task Run([TimerTrigger("0 0 * * * *")]TimerInfo myTimer, TraceWriter log)
{
    //my code
}
As you can see in line #2 I have Timer Trigger with the cron expression to execute this function every hour. For querying the Azure DevOps for git branches, repositories and commits I used Microsoft.TeamFoundationServer.Client nuget package.
I would not go into details, but these are the REST API calls I used to get the details I wanted.
Get the repository details
GET https://dev.azure.com/{organization}/{project}/_apis/git/repositories/{repositoryId}?api-version=4.1
Get the branches in the repository
This call will get me all the branches in the selected repository. Because Gitflow strategy encourages features branches with a naming conventions like feature/* or features/* it was easy to filter the feature branches.
GET https://dev.azure.com/{organization}/{project}/_apis/git/repositories/{repositoryId}/refs?api-version=4.1
Get commits for each branch
Now to detect when any developer committed to the branch, I used following API.
POST https://dev.azure.com/{organization}/{project}/_apis/git/repositories/{repositoryId}/commitsbatch?$top=1&api-version=4.1
To detect the days passed (to get the age), I had to only get the latest commit, so notice $top=1 query string which will return the latest commit. BTW, to search commits only for the selected branch, I had to pass additional request body as below
{
    "itemVersion":{
        "versionType": "branch",
        "version": "feature/add-users"
    }
}
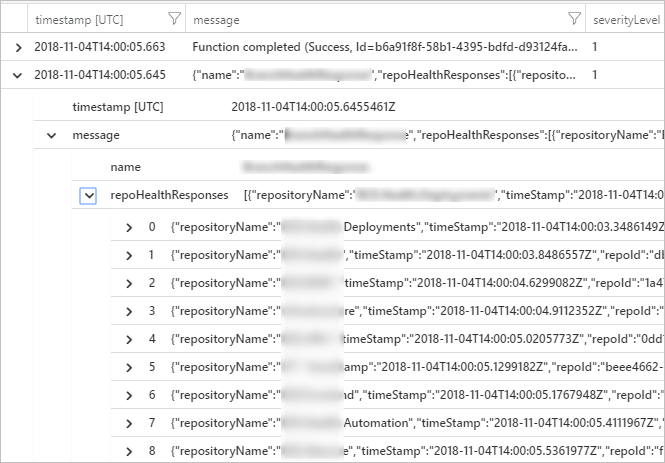
Finally I construct a JSON object with all the data and log to Application Insights.
var jsonResponse = JsonConvert.SerializeObject(response);
log.Info(jsonResponse);
Now this log statement on line #2 above will appear as a trace (as below) in Application Insights.
So that solved two of my requirements - Get the branch details every hour and No database to store historic data
No separate website to display the data and no JS charting library
Now logs in Application Insights can be queried easily using Kusto Query Language. The queries are super fast even when querying a large set of data. There are lots of inbuilt options to render the results into many different types of charts.
So I created few queries to get the data I needed and result rendered as different charts.
For example, below query is to get the feature branches count per repository.
traces
| where parse_json(message).name == "MyResponse"
| top 1 by timestamp desc
| extend d = parse_json(message).repoHealthResponses
| mvexpand d
| mvexpand bs=d.branchStats
| project Repository=tostring(d.repositoryName), BranchName=tostring(bs.branchName), User=bs.committer.displayName, LastCommitDate=todatetime(bs.commitDate), Ago=tostring(bs.commitDateHuman)
| where BranchName startswith "feature"
| summarize count() by Repository
| render piechart
Notice line #10 where I render output as a piechart.
Azure Portal dashboard
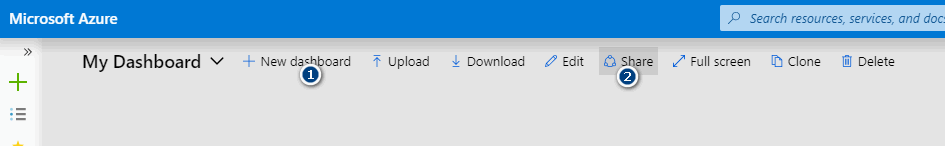
Now in Azure Portal I created a new dashboard [1] and then shared [2] with others.
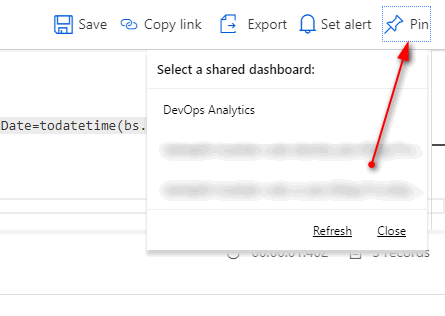
Finally from your Kusto queries editor, Click Pin and select the dashboard you created. Azure portal automatically adjusts the colors based on the portal theme.
That is it, I now have a azure function querying our repositories for the feature branches every hour and Azure dashboard displaying a nice chart with live data about the branches.
Conclusion
I know this scenario is not applicable to everyone. But the combination of serverless Azure Functions + Application Insights, with the help of Azure Dashboards, opens up various options to query and generate nice charts to track trends and usage analytics for your team. Some of the other charts which I think will be useful are
- Track your backlog for the workitems to ensure there is always enough work for your team to take
- Charting all the branches without the branch policies
- Show me all the branches without code reviewers
- And many more.
That is it guys, thank you for reading. Let me know if you think this is useful or anything in this can be improved.